Where there's smoke there's not always fire!
June 7, 2023 By Alan SalzbergIf you live in the Northeast, you have terrible air quality today. You can look out your window and see what looks like a thin but pervasive fog. The sun is blotted out completely or nearly completely despite there being not a cloud in the sky. When you go outside you smell smoke. That smoke is coming from wildfires hundreds of miles away in Canada. How bad is the air right now? Terrible! But to answer that statistically, let's delve into the standard measurements and the historical data. In other words, we need to talk stats!
The EPA has a numbered and color-coded index called AQI (Air Quality Index) that is used for each of five kinds of pollutants. The only two that are ever a concern in NYC are ground-level ozone (mostly from cars here) and particulate matter, which comes in two varieties, 2.5 and 10 (we'll explain below). Like Ozone, PM 2.5 comes in part from car exhaust but doesn't reach unhealthy levels around here unless it is caused by wildire smoke.
The colored and numbered scale for AQI is shown below (from the airnow.gov website):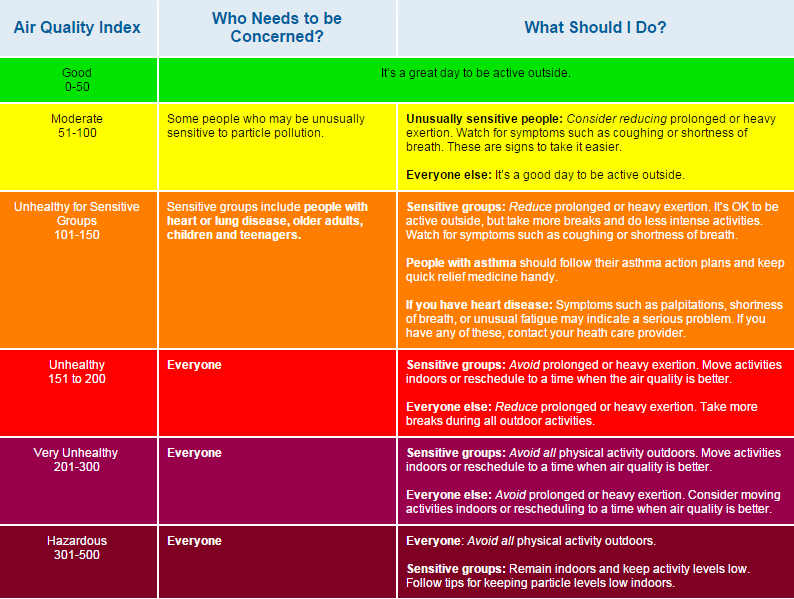
Yesterday, the PM 2.5 index was 179. The day before it was 165, so "unhealthy" on the chart above. To give you an idea of how unhealthy, I downloaded all the index readings for PM 2.5 the last 10 years. Below is a graph of that data (in red), as well as Ozone (in blue).
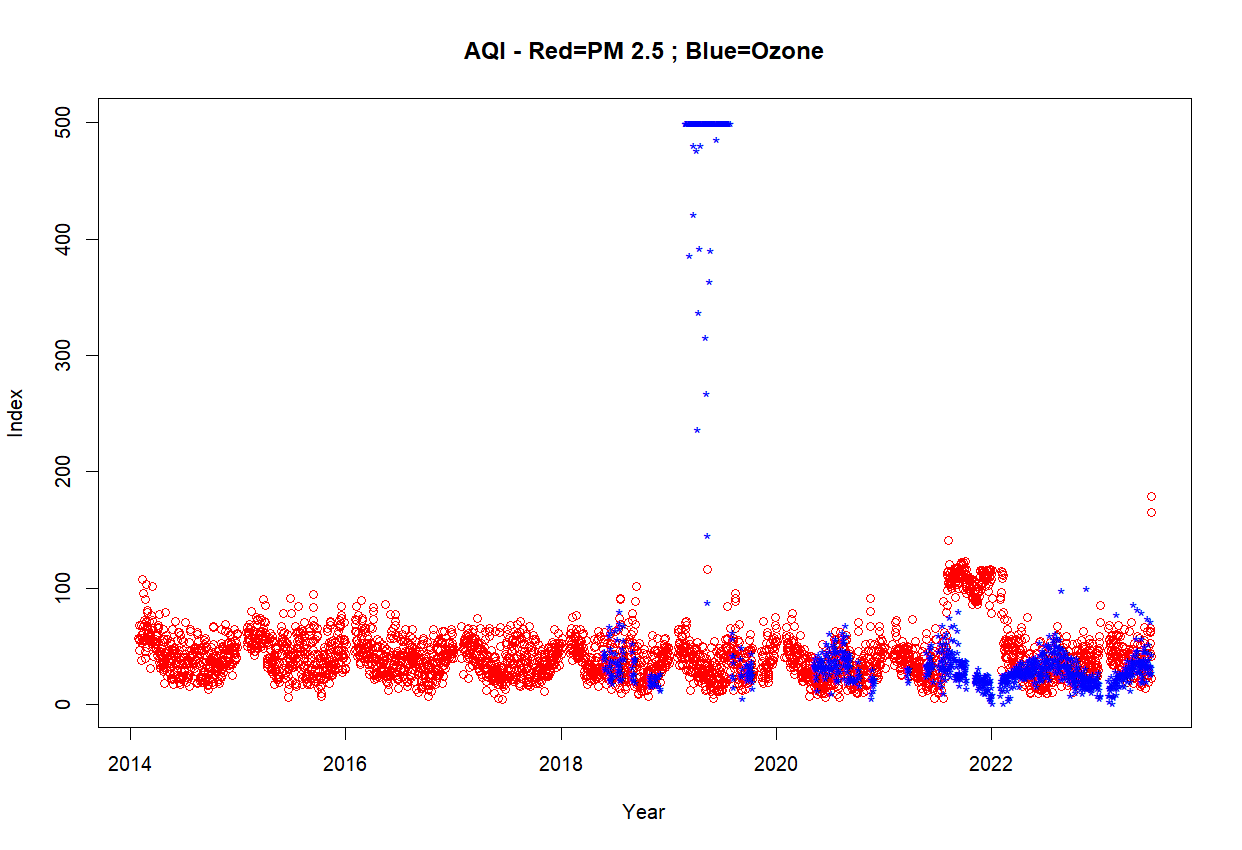 You can see from the graph that the last two red points (on the far right) are the highest in the last 10 years. In fact these are the only two days when the air has been considered unhealthy according to PM 2.5. We have had days with PM 2.5 over 100, and in late 2021, we had more than 100 days of AQI in the category "unhealthy for sensitive groups" (which is the 100-150 range). That time period also corresponded to wildfires and this article discusses that connection (clickable article). What this means that while the air quality will not continue to be as horrible as it is now, air quality could well be poor for some time.
I won't go into detail but note that occasionally ozone is at the top of the charts (at 500), typically on the very worst of hazy summer days, and, in the last 10 years, it has only been above 150 for a brief period -- in the sizzly summer of 2019.
But let's get back to today's problem: PM 2.5 (to a lesser extent PM 10).
So what is PM 2.5 anyway? PM 2.5 refers to particulate matter that is 2.5 microns and less (a micron is a millionth of a meter).
So how big is 2.5 microns? To get an idea of scale, a human hair has a width of around 80 microns, and once we get down to 50 microns, we are below the visible range. And of course we need a Covid comparison -- Covid is around 1/10 of a micron and most viruses are smaller still. Wildfire smoke can be up to 10 microns but most of the problematic smoke (that lingers) is well below 2.5 microns. Unfortunately the smaller particles are worse because they go deeper into our lungs (see this article).
How does the amount of PM 2.5 translate to the 0-500 scale? The basic measurement is volume: micrograms of PM 2.5 per meter cubed of air. Of course this isn't helpful without context. To give some of that context, this volume is less than 12 (micrograms per meter cubed) on a nice clear day with an AQI of less than 50 (3 out of 4 days in NYC are in this range). On a hazy day due to PM 2.5, with an AQI of 100-150, the volume is around 40 (less than 1 in 20 days is this bad). Yesterday was unprecedented, with an AQI of 179 (a volume of more than 100). It's unclear what today's average will be but right now the AQI is an astonishing 392, with a volume of nearly 400 per meter cubed.
What's the net-net here: stay inside, at least until the worst of this subsides!