My last Covid post
January 16, 2024 By Alan SalzbergI hesitate to write another Covid post, because I figure no one worries about it anymore. But people do get it, and my food coop recently instituted a masking policy two days a week (despite the dearth of evidence regarding masks -- see my earlier blog: https://salthillstatistics.com/posts/122 ).
In truth, Covid does continue to be an annoying virus, but it is minor for most. I finally got Covid (first time) in July 2023. It was terrible for one evening. Then with Nyquil and Dayquil, it was fine. Total days with drugs/fever: 3. I had not been vaccinated for well over a year when I got it.
Of course, anecdotes aren't worth much. We need statistics. I'll start with the worst (death) and then go to the very bad (hospitalization).
I am using NYC because they track deaths annually, and, unlike the CDC and national data, they are up to date. See here (https://coronavirus.health.ny.gov/fatalities-0 ) for fatalities and here for hospitalizations ( https://coronavirus.health.ny.gov/daily-hospitalization-summary ). You can download these datasets and do your own graphics if you like. Fun!
Covid's worst week in NY ended April 11, 2020, when 6,900 people died. In the next three years, the worst weeks were in Jan. The week ending Jan 16, 2021 saw 1,473 deaths; the week ending Jan 15, 2022 saw 1,463 deaths; the week ending Jan 7, 2023 saw 277 deaths, and the week ending Jan 6, 2024 saw 145 deaths.
So from 6,900 to 1,473 to 1,463 to 277 to 145. Our 2024 peak is 2% of the worst week and about half of where we were last year (and it does seem we've peaked in 2024).
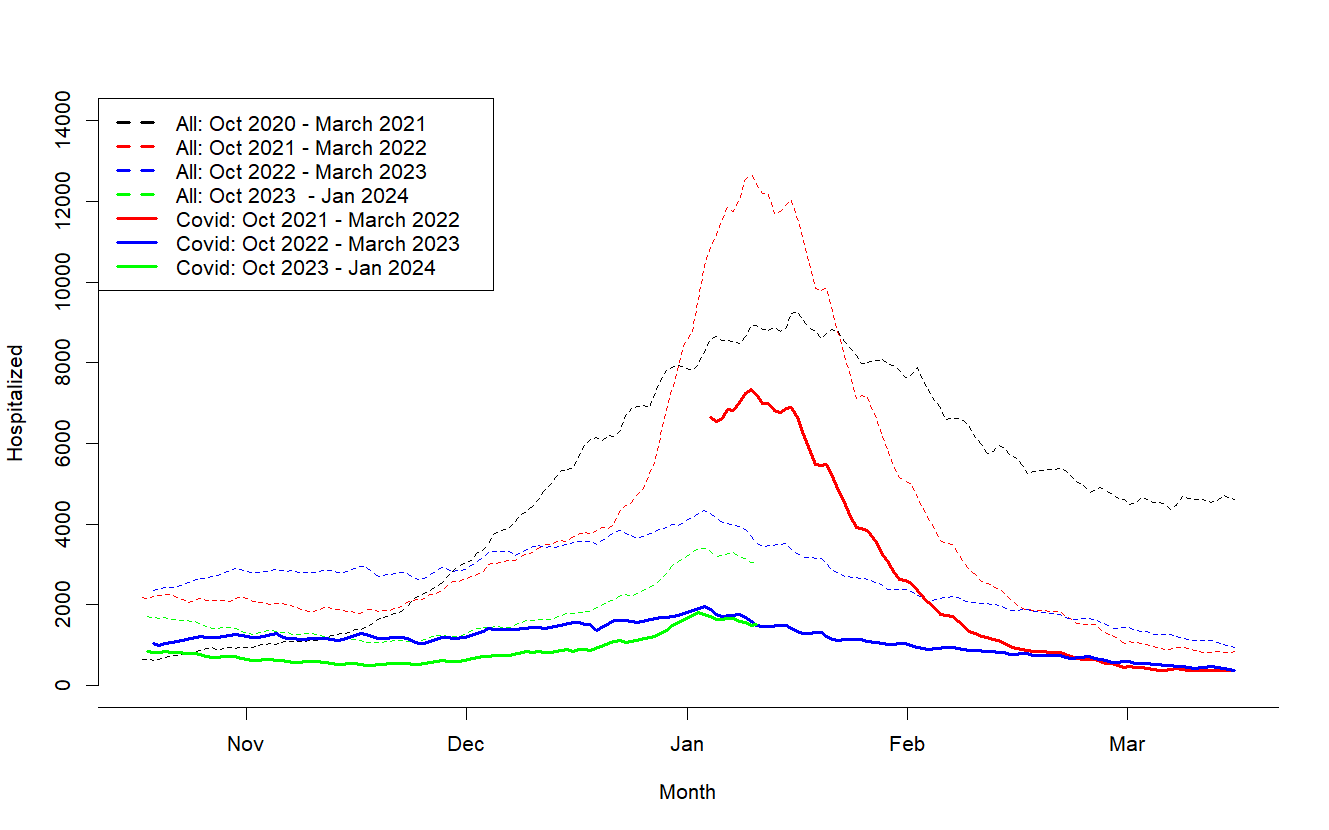
How about hospitalizations? The story is not as dramatic, but Covid hospitalizations peaked at about 10% below last year and it looks like total people hospitalized for Covid will be much further below last year. Here, as in my prior blog about hospitalizations (https://salthillstatistics.com/posts/129), I track all hospitalizations (of people who happened to have Covid -- dashed lines) and hospitalizations due to Covid (solid lines). The hospitalizations with Covid is more than twice as high as those from Covid because many people go to the hospital for something unrelated (say, a broken arm) and then find out they have Covid. These are less worrisome cases (though of course for very sick people that can end up being a cause of death).
In any case, here's the graph, and I've just shown the winter season each year. Note the solid lines start at the beginning of 2022 because before that those hospitalized due to Covid were not separately tracked.
I should also note that, unlike earlier in the pandemic, it has been well over a year since the vast majority of people got any Covid shot (fewer than 20% got the 2022 booster and fewer still got this years). So, vaccine or not, you're as safe as you have ever been regarding serious effects from Covid.
The other interesting thing (not shown in the graph), is that Covid has become quite seasonal. Summer hospitalization and death rates are now only about 15% of winter rates. Covid doesn't go away completely (afterall, I got it in July!), but the vast majority now get it in the fall/winter.
Covidover and out! (but stay tuned for my upcoming blogs on other statistical topics)