Does this graph tell the real story about wages for low-skilled workers?
January 13, 2019 By Alan SalzbergAn article in today's NY Times says that low-skilled workers used to have a big jump in income if they worked in an urban area but that difference is disappearing. You can read the whole article here. The article talks about a presentation by MIT professor David Autor (which can be found here).
The times article chooses the graph below to make it's main point that the advantage of big cities for low wage workers is disappearing.
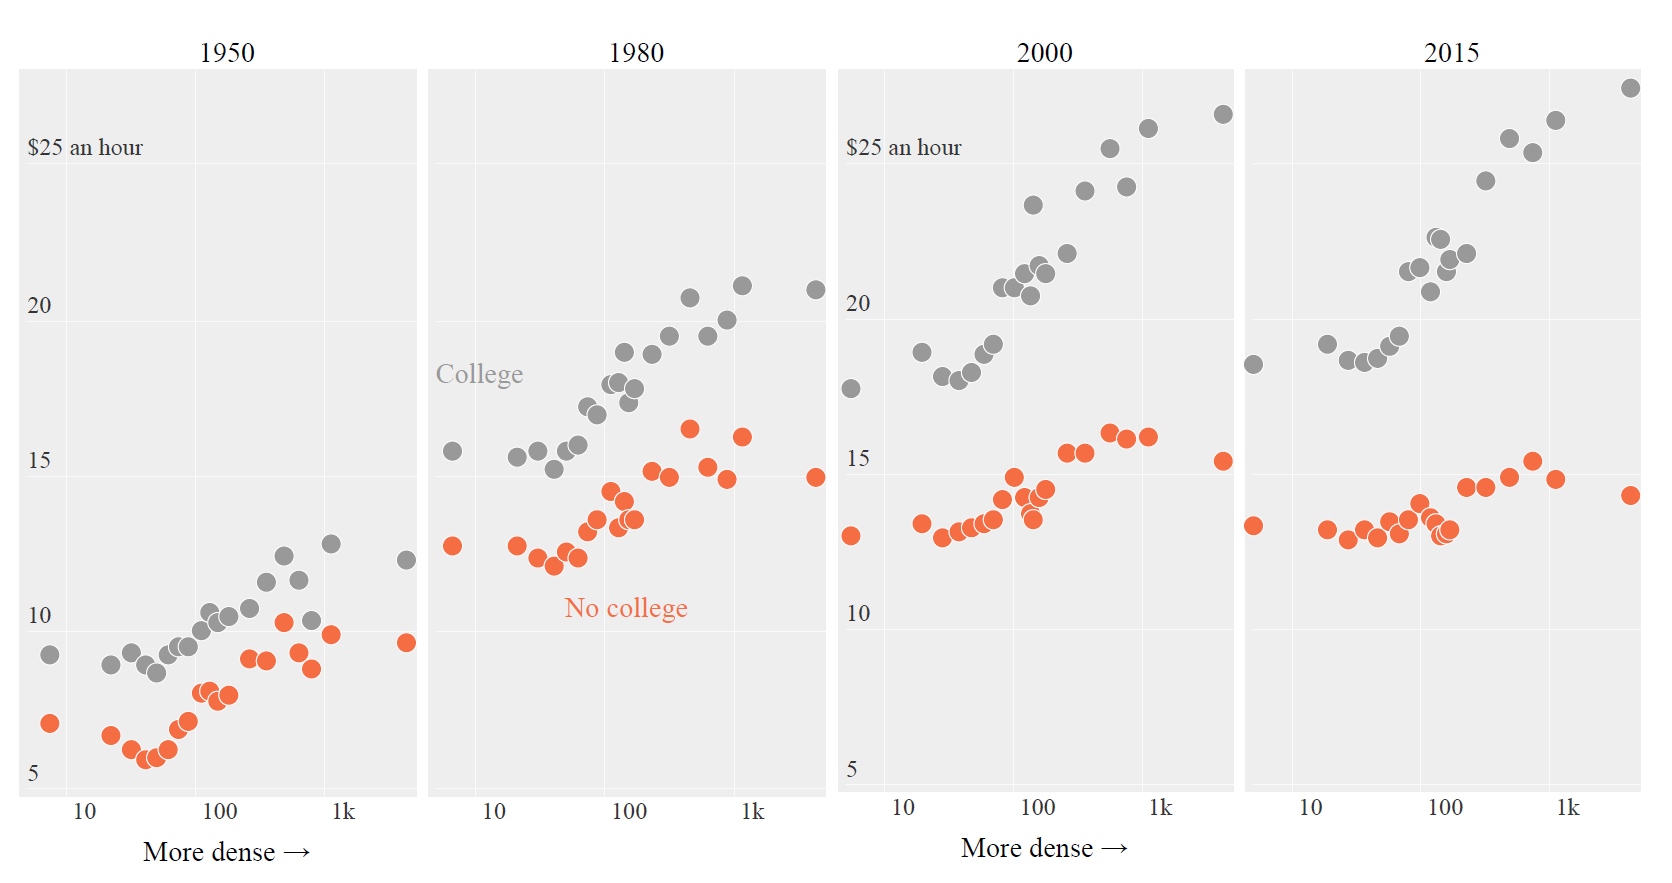
The graph has four panels. The main point is about less educated workers, defined as workers with no college (the orange dots). In 1950 (shown in the left-most panel), those workers were making roughly $6 an hour in rural areas (less dense areas) but nearly $10 in urban (more dense areas). In other words, in 1950, someone with no college averaged more than 50% more per hour in the biggest cities than someone with similar education in the most rural areas.
By 2015, workers with no college were making about $13 per hour in the most rural areas and about $15 per hour in the big cities, a difference of less than 20%. In other words, the big-city premium for these workers went from 50% in 1950 down to 20% now. So these folks have lost most of their benefit to moving to big cities it seems. Slam dunk, right?
Well, not so fast. The problem with this simple graph and presentation is that the populations have dramatically changed. In 1950, more than 75% of workers had no college at all. Now, only 33% of workers have no college (this is talked about at around 3 minutes into the presentation from Dr. Auter but ignored in the NY Times article). So referring to the graph again, the 1950 graph shows the average for the bottom 3/4's of the population in terms of education, but the right most graph shows the average for the bottom third.
Because of this apples-to-oranges comparison, there is no way to know from the figure whether the premium for being in the city for the least educated workers has increased, fallen, or stayed the same.
-Alan (1/13/2019)
Another note: the data for this article was from 2015. In addition to a like-to-like comparison, it would be interesting to see what impact the $15 minimum wage for New York City (as of December 2018) had on the urban/rural divide.