State Virus Update
March 31, 2020 By Alan SalzbergWe made it through the weekend. Is Lousiana still the worst? Maybe.
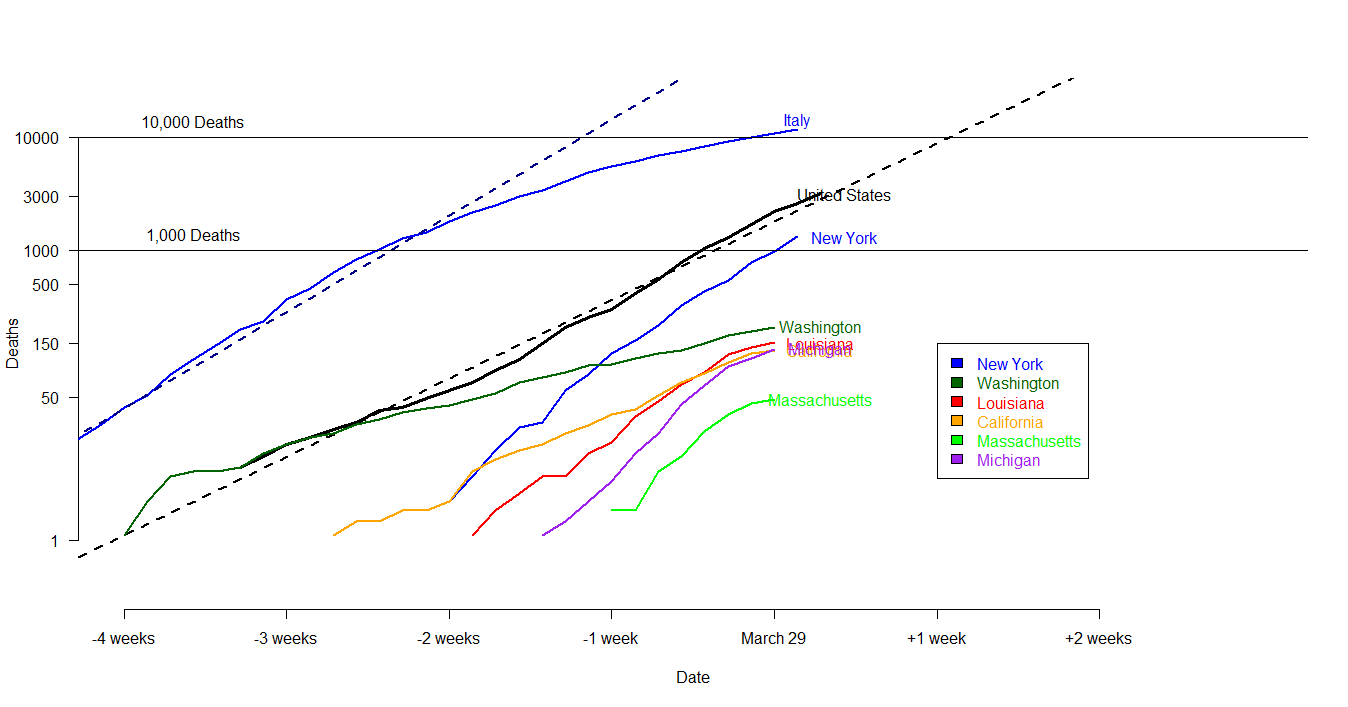
As before, I've graphed deaths on an exponential scale, which means a straight, upward sloping line indicates exponential increase in growth, and a doubling of cases every X days, where X varies depending on the slope (steeper lines mean a quicker doubling). The slope makes a much bigger difference than the absolute level. Therefore, even though on the graph below Washington continues to be second only to New York, Lousiana and Michigan appear to be worse, and will soon overtake Washington.
If we get to a point where instead of a line, we have an arching curve, we know we are starting to beat the disease. This is the point where the R, or reproduction rate, falls below 1, and would mean that each infected person infects, on average, less than one person. Once you get to that point, the disease will die out. We will have a special guest blogger talking about this in the next Salt Hill blog.
I think this will happen in the next couple of days in New York, based on their restrictions a couple of weeks ago. For other states, it will depend on when they restricted contact. (Don't be fooled by the flattening in the last day in many states -- this is because, except for NY, most of the data was not in yet for the last day.) My fear was, and is, that Louisiana was very late in doing that, so might see there deaths continue to exponentially increase for some time.