What is R0 and why do you care?
April 3, 2020 By Josh LafairAnother guest blog! Josh Lafair, who was doing a gap year between high school and college in Israel, is now spending some of his time helping me to research COVID-19. Thank you Josh!
As the US moves into the next stage of COVID-19 mitigation, a key element in stopping the disease is reducing the infection rate. An important factor in calculating the rate of infection is the reproduction rate. You might have heard the term R0 (pronounced R naught), which is the average number of new infections caused by each infected person. The 0 subscript indicates at time 0, meaning before any social distancing, governmental intervention (school closures, work stoppages, etc.), vaccine or natural immunity.
Once the infections begin, we worry about Rt (for convenience, below I am just going to write R, R0 and Rt but the 0 and t should be a subscript), which is the reproduction rate at time t. With no interventions and if most people have not been infected and are not currently infected, there is little reason for Rt to change from R0 (unless the virus mutates).
Keep in mind that R0 and Rt are not the infection rate. To know the infection rate we need to know both R, the number of people infected by each person, and the time it takes to get infected. Suppose R0 is 2, and it takes exactly one week to infect someone. Then, the infections will double every week. Week 0 (start of disease): 1 person, who then infects 2 people at Week 1, who each infect 2 people so we have 4 new infections at Week 2, who then each infect 2 people so we have 8 new infections at Week 3. This continues so that by Week 10, we have over 1,000 new infections, by Week 20, more than 1 million, and by week 30, more than 1 billion!
This is incredibly scary! The reason why the increase is so fast is that it is exponential, meaning that we calculate the new infections by putting the reproduction rate R to an exponent. As long as R is greater than one then R to some power (greater than 1) is bigger than R. To understand this better, let’s look at a simple (and admittedly overly-simplistic) mathematical equation for the number of new infections in d days. If we assume a constant time to infection, which we will call k (and keep in mind that actually that time would vary), and a constant R (perhaps unchanging from R0), the equation for the number of new infections i in d days is :
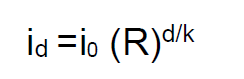
In the equation above, id is the number of new infections in d days and i0 is the number of current infections.
This looks complicated but we can make computations from it fairly easily. Suppose that we currently have 100 infections. Suppose k is 3, meaning it takes 3 days for a newly infected person to infect someone else. After 9 days (d=9), we will have three cycles of infection (d/k = 3). If R is 2, it means we take the initial number 100, multiply by R (2) raised to the power of d/k (3). Essentially the infections are starting at 100, multiplying by 2, then multiplying by 2 again (for the second cycle), and then multiplying by 2 a third time (the third cycle).. So after 6 days, we have 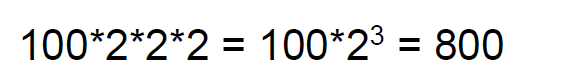 Therefore, we have 800 new infections.
Playing around with this equation, you quickly find that the current number of infections does not matter much as long as the R is high and does not change, because the increase is so quick. This is why we need to worry about areas that only have a handful of infections. Ten infections become 10,000 new infections in 10 cycles if R remains at 2.
What if R is less than 1? In that case, the number of new infections is still guided by the same equation but at each cycle, the number of new infections is less than the number of current infections. So if R is .9 and we begin at 100 infections, after 1 cycle, you have 90 new infections, followed by 81 new infections, etc. Eventually there will be no new infections and the disease will die out.
How many cases would there be between now and the time it dies out?
This is the current number of cases multiplied by R/(1-R). So for 100 cases and an R of .9, it is 90/0.1 = 900. Thus there will be 900 new cases before the disease dies out. Note that this equation, which you might remember from your math classes years ago is the sum of an infinite geometric series, only works when R is less than 1. If R is greater than 1, the number of new cases is infinite and it never dies out. (what actually happens when R is greater than 1 initially is that eventually, as enough people are infected, the R drops to below 1, but that does not happen until a very large and intolerable people are infected).
So our goal, which we will discuss more in a future blog, is an R below 1.
But for now, let’s return to the R0 and what it might be for COVID-19. Finding the R0 for COVID-19 has been an extraordinarily difficult for multiple reasons:
- Coronavirus infects each person for a long and varying period of time, which gives a long but indefinite time period for calculating the reproduction rate. People with the illness can pass it on anywhere from days to weeks after they contract it.
- Due to insufficient testing capabilities, it is impossible to truly know how many cases there are in the US or anywhere in the world.
Estimates have varied, but nearly all of them have shown an R0 of above 2. This study of the Princess cruise ship put R0 is 2.28, with a 95% confidence interval that it’s between 2.06-2.52.
This U. Michigan blog entry cites studies indicating that R0 is somewhere between 2.2 and 3.6. In this range, we can expect that unfettered COVID-19 would double every few days (assuming a time to infection of a week or perhaps less). This is the reason nearly half the world is under some form of restriction right now -- the R0 is high enough that, unfettered, the disease will quickly spread through the population and kill millions.
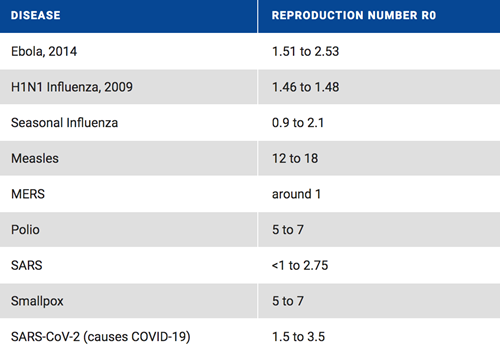
As a means of comparison, consider the following table (from here) that estimates the R0 of various diseases (with COVID-19 at the bottom of the list).
In a future blog, we will talk about implications of restrictions and what the goal might reasonably be for reducing R.