Do we really have 2 million cases in New York City?
April 28, 2020 By Alan SalzbergA recent study of antibodies indicated that more than 20% of New York City residents had antibodies to COVID-19, indicating that close to 2 million of us had COVID-19.
This estimate turns out to be consistent with the total number of deaths and a 1% overall death rate, and it also is consistent with the daily number of deaths, when considering the expected effect of the restrictions.
So here's what I did to make this determination. I started with the New York City deaths, found at the New York City Department of Health github (https://github.com/nychealth/coronavirus-data ). New York City reports both confirmed COVID-19 deaths, who had a positive COVID-19 laboratory test, and probable COVID-19 deaths, which are deaths for individuals whose death certificates listed COVID-19 but who did not have a known test. I use the total of these two categories. Other studies, including this one (https://www.nytimes.com/interactive/2020/04/21/world/coronavirus-missing-deaths.html ), concluded the deaths in NYC are higher than the total that I use.
I model cases by assuming the following:
1) an overall 1% death rate (discussed in a previous blog: https://salthillstatistics.com/posts/70 )
2) a time from transmission to death that averages about 17 days and follows a gamma distribution, which in this case is a right-skewed distribution, meaning that some people who die take a very long time and few people take a very short time.
3. A rate of increase for new cases beginning at 31% daily, falling to 16% with school closures, falling to an 8% daily decrease beginning with complete closure, and a further decline to a 14% daily drop after a week of full closure.
4) I began with 175 cases on February 22.
The assumptions in 2 and 3 are taken from an Imperial College of London Paper (https://www.imperial.ac.uk/media/imperial-college/medicine/sph/ide/gida-fellowships/Imperial-College-COVID19-Europe-estimates-and-NPI-impact-30-03-2020.pdf ). I started with their models but then varied it (typically within their confidence bounds), to better model the US data. An important thing to know about what is to follow is that the results below can change dramatically when the assumptions are changed AND that there are more than one set of assumptions that gets you to a good model fit. Also, the initial cases of 175 on Feb 22 is not only higher than the official case count, February 22 is more than a week before even a single NYC case was reported. While the 175 is somewhat arbitrary in light of that information, the official count is widely agreed to be wrong and a huge underestimate, and we could never had had as many deaths as we do if we had no cases before March 1.
With all that preamble, the graph below shows the reported deaths versus my model.
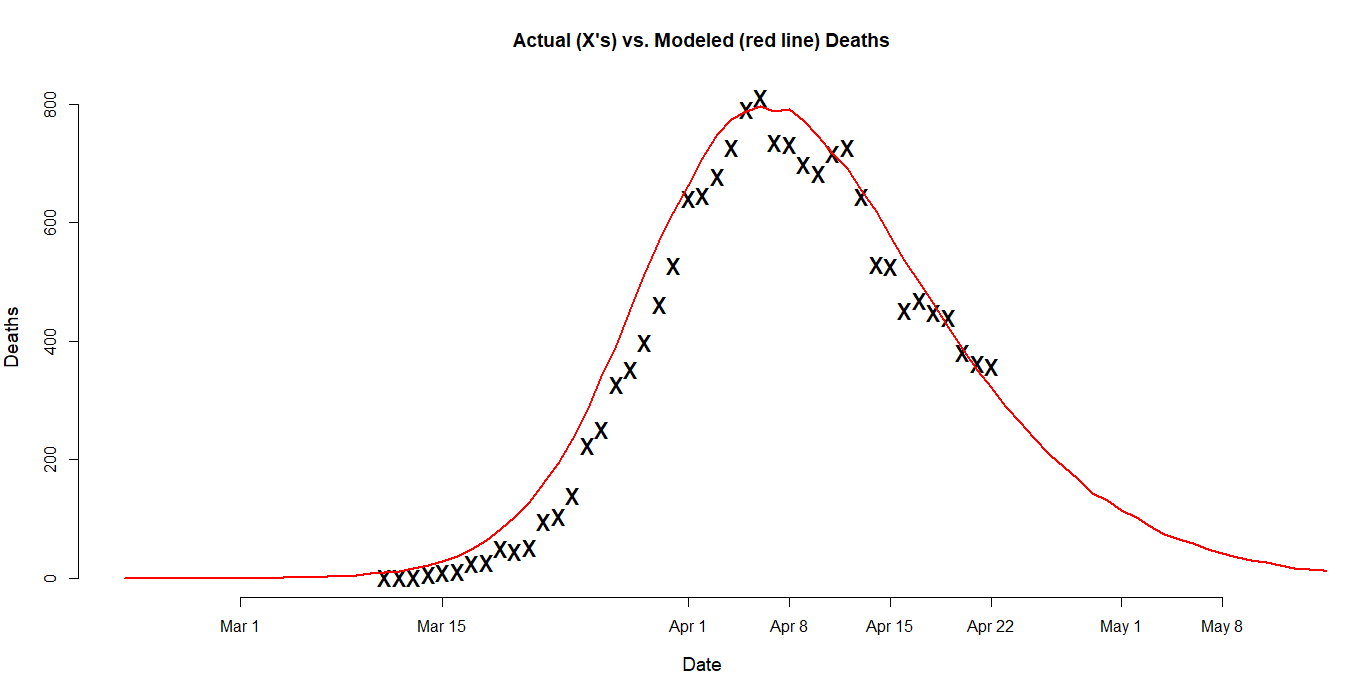 As you can see this model results in very good day-by-day predictions of number of deaths.
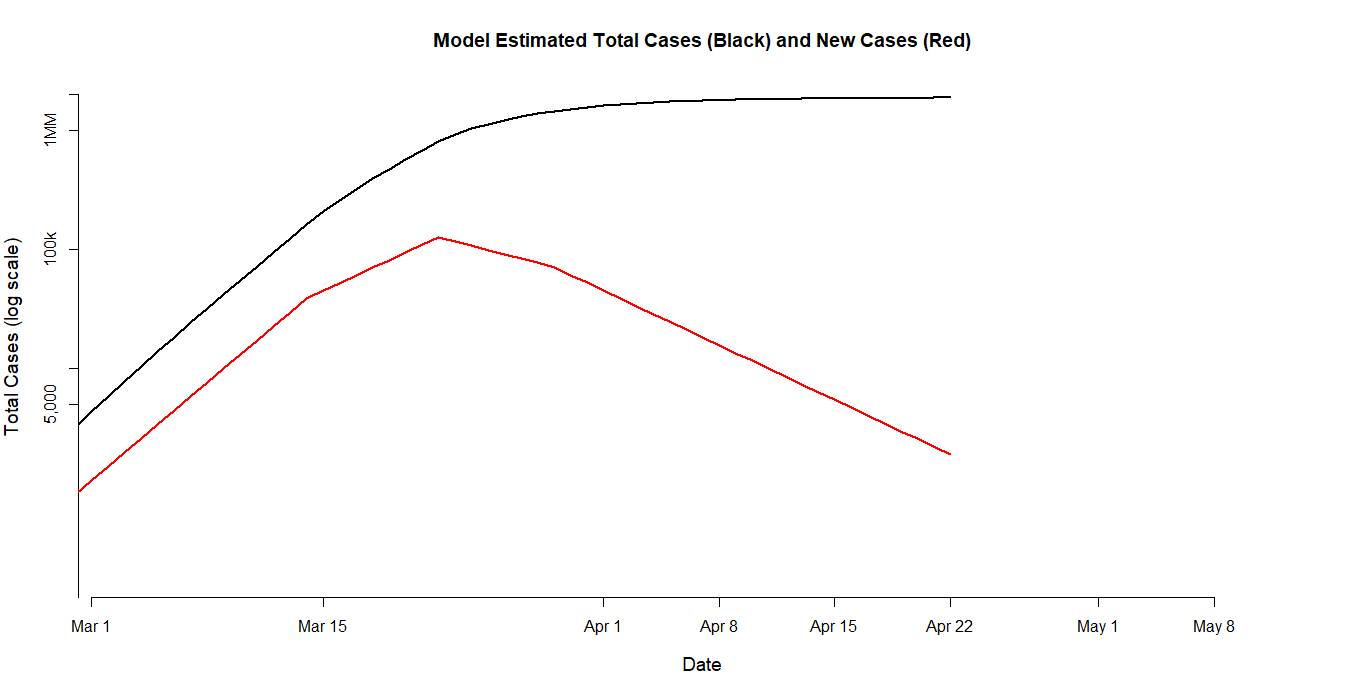
What number of cases did the model predict?
Here are some highlights:
March 1: 4,300 total cases, 1,200 new cases that day
March 16 (the day we closed schools): 260,000 infections, 52,000 new cases that day
April 22 (last day of updated data): 1.87 million total cases, 2,000 new cases that day
A graph of this case model is below (with the y-axis in log terms):