Brooklyn data look good
June 17, 2020 By Alan SalzbergLike the stock market lately, I'm going to focus on the positive just a little more after my last optimistic blog (https://salthillstatistics.com/posts/75 ), before looking at what's going on in the South in a soon-to-appear blog.
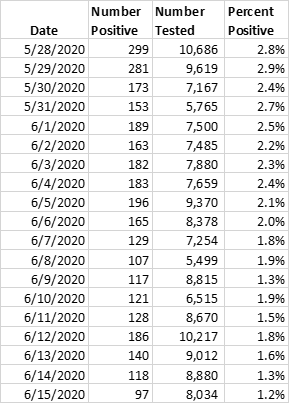
My home boro of Brooklyn had it's first George Floyd protests at the end of May. Now it's nearly three weeks later. Cases have continued to fall. There was simply no discernible protest 'bump' in cases. It may have been that there was a small increase due to the protests but it was not as large as the underlying decline occurring for other reasons. Given the number of people at the protests, the data are an indicator that outdoor activities of all kinds and durations are safe now. We could still see an uptick due to the protests, but it is increasingly unlikely, because we've had time for 3 to 4 cycles of infection to occur already. We are now at a barely 1% positive rate among those tested, meaning the underlying rate of infection in Brooklyn is some fraction of 1%.
Here is a table of the data for Brooklyn since the protests began.
Enjoy this period! We could have a return to higher levels later in the summer or fall.