The South is in Trouble
July 1, 2020 By Alan SalzbergI long focused on deaths and not cases in my data analysis. Deaths give you a view of history--deaths today tell you something about who got sick a few weeks ago. So if we want to know what is going on now, we need to look at cases. But confirmed case counts are highly correlated to the amount of testing done. If you are not testing anyone, you don't have any confirmed cases. While not testing is seen as a solution by our dear leader (https://apnews.com/476068bd60e9048303b736e9d7fc6572), most state public health authorities are living in the real world and have increased testing. So how do we know if increased cases mean a larger rate of infection in the population or just more testing?
There is a good, albeit imperfect, shortcut: look at the percentage of tests that are positive. If this percentage is increasing (or even staying the same) while the total tests increase, you have a problem. Before explaining this, let's explore how testing generally expands. In most circumstances, when testing is limited, the sick get tested. This is the first stage of testing. If there are enough tests for the sick, then we go to Stage 2: people who were in contact with the sick are tested. From there, you can got to Stage 3: people who think they may have been in contact with someone with COVID, or were in a crowded place. In NYC, for example, we are essentially in Stage 3. There is still a fourth stage, where everyone gets tested (I don't know if we'll ever get there). At Stage 1, which includes only ill people with COVID-like symptoms, the chance of actually having COVID is the highest. As we progress through each stage, that likelihood falls. At the last stage, where everyone is tested, then the chance of testing positive is the same as the chance of having COVID (I'm ignoring false positives here, which can be important but are not important for this discussion).
What the progression above means it that as the number of tests increase, the percent who test positive will go down, all else being equal, because you are including people who are less and less likely to have COVID. However, in some states, it is going up or at least staying the same. There is one primary explanation for this: at the same time that we are expanding the categories of people we test, more and more people are getting infected. So the percentage at every stage is higher, and the percent positive overall can remain steady or even increase as we expand testing to stages with relatively lower rates of infections.
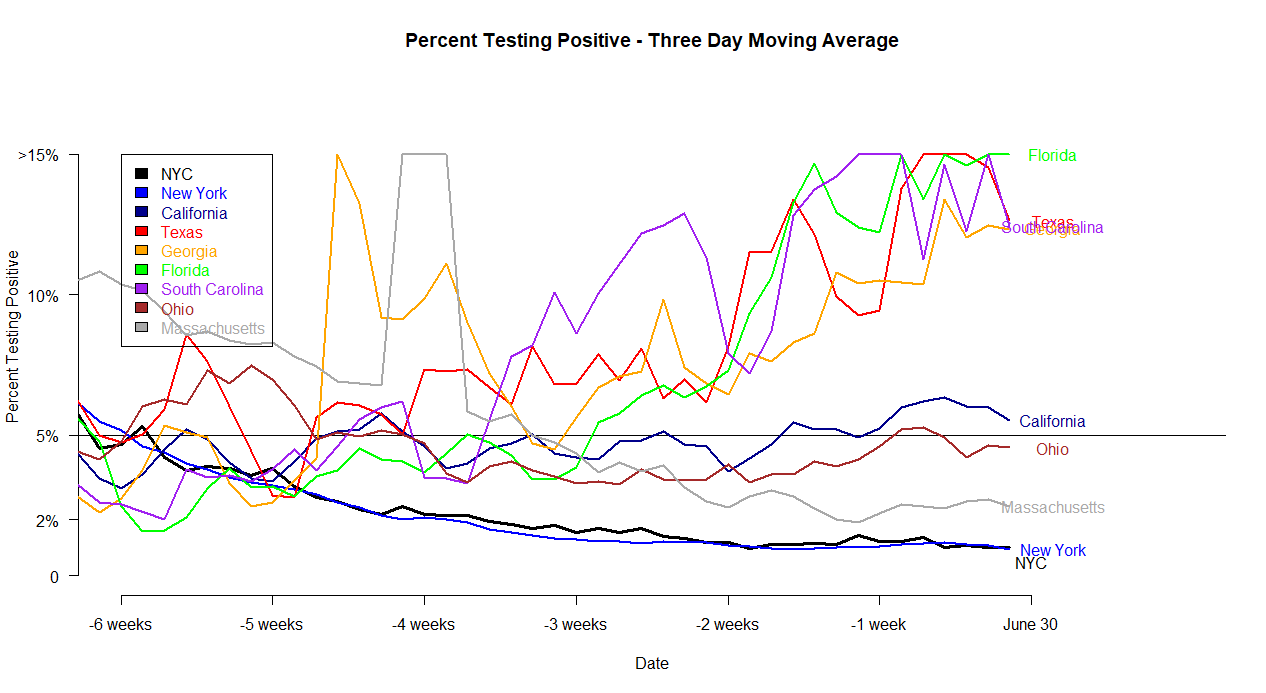
So how does the country look right now? I graphed the positivity rates in select states and NYC. NYC and NY State look great, with rates falling for weeks to the positive rate of about 1% that we are at now. CA and OH have not had huge increases in testing but their positive rates are steady or possibly increasing--the story is unclear there. The real problem is the South. The South looks terrible, with positive tests around 10% and up (I capped it at 15 in the graph below). All four southern states (I'm including Texas as southern, as well as GA, SC, and FL) had positive rates of 5% or less 6 weeks ago and have seen at least a doubling of that rate, with much of the increase in the last couple of weeks.
The "why" is the subject for another blog, but here are some hints. We know that COVID does not spread well outdoors. It also appears that the effect of the protests on infections was small or non-existent. The big thing that did change is that around Memorial Day (with some variation), indoor bars and restaurants began reopening and/or loosening capacity restrictions in states that are now seeing large increases in cases. CA has just backtracked on indoor dining, and NY has just decided to wait longer before opening restaurants indoors.
So how do we avoid this increase when we re-open indoors. There is a way: effective contact tracing. We can do it, as I described in a previous blog (https://salthillstatistics.com/posts/73 ), but will we?