Sometimes one graph says a lot
October 16, 2020 By Alan SalzbergA natural comparison to COVID is with the 1918 flu. The 1918 flu was much more severe, but the more interesting difference is that the 1918 flu killed many younger people, while COVID deaths are overwhelmingly among older people.
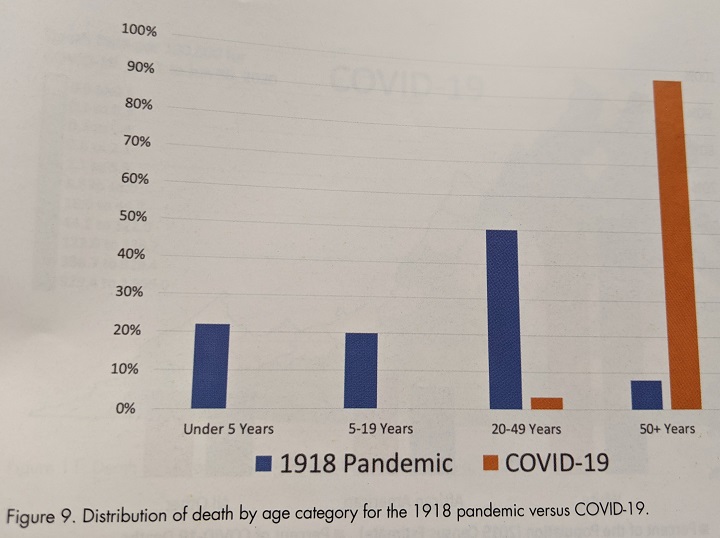
The graph below is taken from the latest issue of Chance magazine (put out by the American Statistical Association). It shows the age differential in dramatic relief (using Virginia data, because that was very detailed for the 1918 flu). About half the victims were 20-50 years-old for the 1918 flu versus about 5% for COVID ( COVID-19 has almost completely spared minors). About 10% of deaths were for people above the age of 50 for the 1918 flu versus about 95% for COVID, a difference much too big to be accounted for by different life expectancy.