The Second Wave
November 16, 2020 By Alan Salzberg"Prediction is difficult, especially about the future." So said Niels Bohr (actually, not him, but perhaps Mark Twain, or perhaps not him either). In any case, I agree. And I really do not have a great answer to where COVID is going, but a few things seem likely:
1) Deaths will rise to close to 3,000 per day in the next few weeks. This is if the current CFR (case fatality rate) of about 1.7% holds (keep in mind that the IFR, or infection fatality rate, is well under 1%--probably around 0.25% at this point, but we only know confirmed cases and not total infections, so we predict deaths based on confirmed cases). Remember that cases today predict deaths in about 3 weeks. Therefore, since we have had some days with around 150,000 confirmed cases, we can expect 2,500 - 3,000 deaths, at least for a day or two, sometime in the next three weeks, even if cases fall off from their current level.
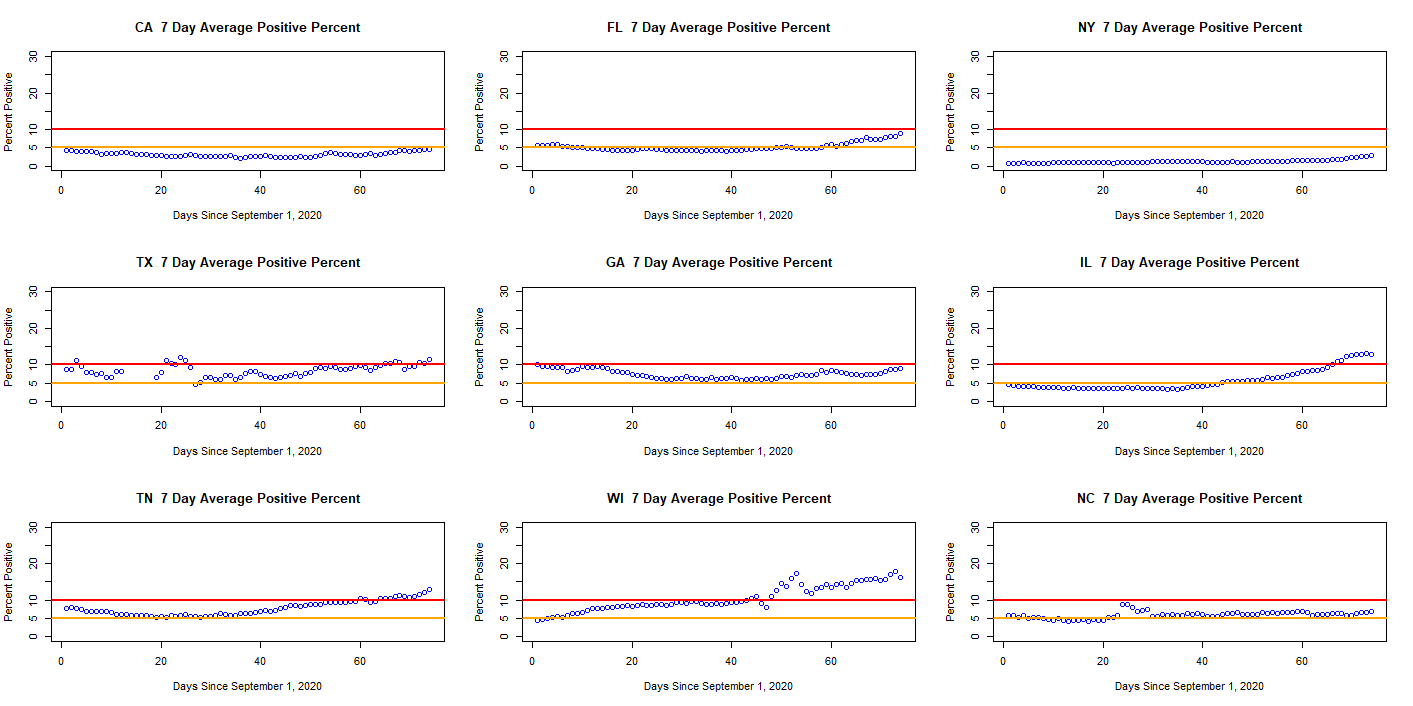
2) In many states, we are in a second wave. It is not at all clear how serious this wave will be. Of the 9 states hardest hit with COVID (these states encompass more than half the US population), 3 states (FL, IL, and TN) had fallen below the 5% positive threshold JHU uses for opening up (see JHU Guidelines) but have now risen back above it. NY and CA are rising a little but still below the 5% threshold. TX and GA are slowly rising but never really fell below the threshold (opened back up anyway). NC appears to be fairly stable. Finally, WI is quite high but still experiencing their first wave. Keep in mind that the actual rate of infection is well below the positivity rate, as I have discussed previously.
3) The winter will bring a rise in cases. Right now, though, of the three biggest states, only Texas has a serious outbreak. Most of the other states with serious outbreaks are small, and in some, it appears to be declining. However, given that most of the country has still not had a high percentage infected, it seems inevitable that infections will rise as people begin doing things indoors in the cold weather, as I said in my last post (https://salthillstatistics.com/posts/87 ).
So I really have no idea when cases will peak or how high they will be when they do. But I did create some graphs showing the positivity rate in the 9 states with the highest total number of confirmed cases since March, with an orange line showing the 5% positivity point and a red line showing the 10% point. These graphs show positivity since September 1.